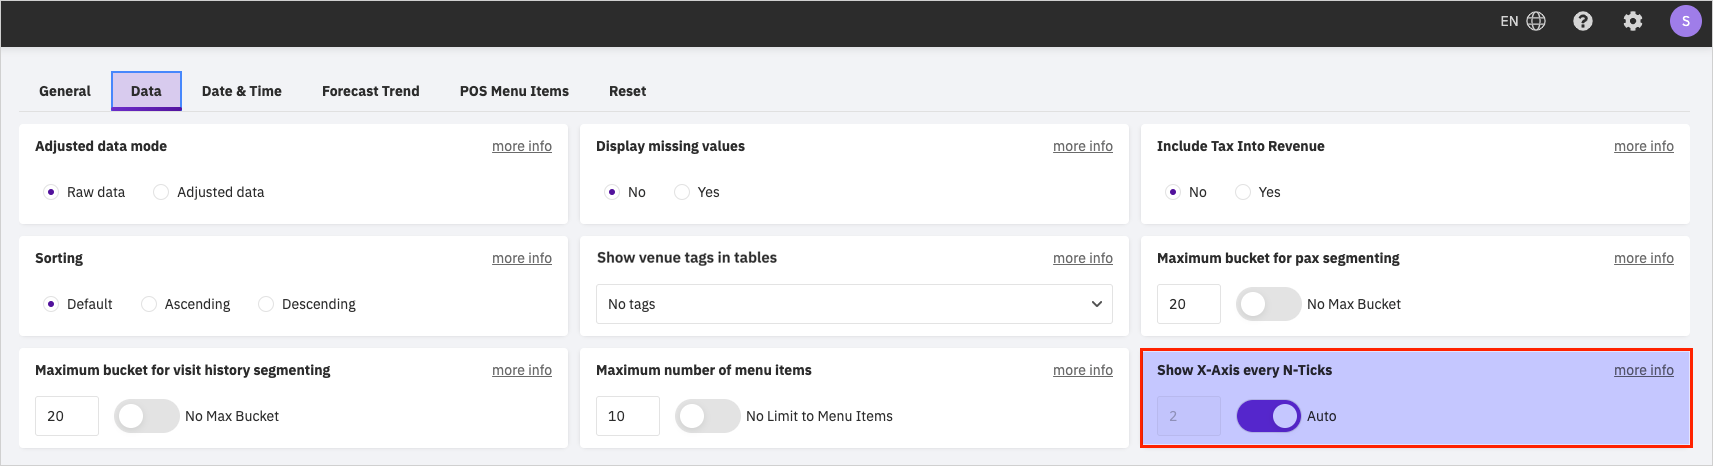
There are two settings that can adjust the display of x-axis labels in charts: a global setting that applies to all charts (Settings page -> Data tab), and a separate chart setting (accessible via the "Style tab of the chart editor") that can override the global settings. The global default automatically displays x-axis labels so that there is no overlapping of label text. For example, if chart labels become illegible, the "Auto" mode will automatically display x-axis labels such that only every N labels are displayed, where N can take positive integer values. The global user setting can be adjusted so that all charts display every N labels.